Class 6 · Year project
Our school in data
Be the data scientist. Ask a real question about your school, count the answer for a week, and find the pattern hiding in your own numbers.
The big idea
All year you have learned that AI learns from data. Now you will be the data scientist. Your group will ask a real question about your school, collect the data, and find a pattern in it, just as an AI system does, but with your own eyes and brain.
📱 Scan to watch: How to be a data detective.
The golden rule: no personal data
Your data must be about things and counts, never about named people.
| ✅ Allowed | ❌ Not allowed |
|---|---|
| How many students come by bus, on foot, by car | Who comes by car |
| Number of pieces of litter in the playground each day | Photos of students |
| Which of 5 fruits the class likes most (anonymous slips) | Anyone's name, marks, address or phone number |
| Temperature in the classroom at 9 am and 12 pm | Whose tiffin has what food |
If you are not sure, ask your teacher before collecting.
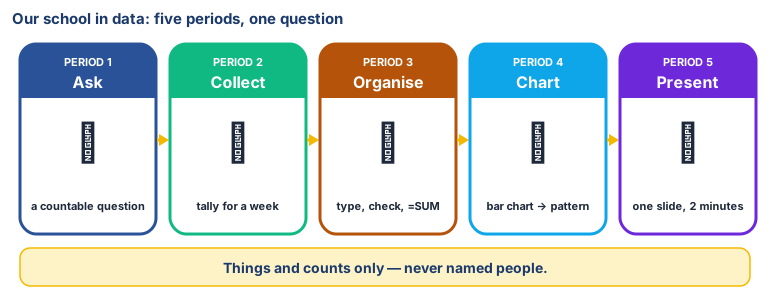
Period 1: Choose a question
- In your group (3–4 students), list five questions about your school that can be
answered by counting or measuring. Ideas:
- How do students in our class get to school?
- On which day of the week is the playground the most littered?
- How warm is our classroom at different times of the day?
- How many birds visit the chinar tree at recess?
- Which books are borrowed most from the library?
- For each question, ask: Can we collect this in one week? Is it safe and fair? Does it use any personal data?
- Choose one question. Write it at the top of a new LibreOffice Calc file and save it
as
our-school-data.ods. - Write your guess (a prediction) under the question. You will check it at the end.
Keyboard warm-up: type your question three times. Aim for no mistakes.
Period 2: Collect the data
- Decide how you will collect it: tally marks, a thermometer, anonymous paper slips, or counting.
- Decide when and how often (e.g. every day at recess for 5 days).
- Make a paper tally sheet, and collect your data over the week (outside class time where needed).
- Write down anything strange that happened (e.g. "Tuesday: it rained, so nobody played outside"). Scientists call these notes, and they help explain patterns later.
Period 3: Organise it in Calc
- Type your data into Calc. Put the categories in column A (e.g. Bus, Walk, Car) and the counts in column B.
- Check every number against the tally sheet. One wrong number changes the answer. Swap with a partner to double-check (this is debugging your data!).
- Use a formula to find the total: click a cell and type
=SUM(B2:B6), then press Enter. - Challenge: find the biggest value with
=MAX(B2:B6)and the average with=AVERAGE(B2:B6).
Period 4: Chart it and find the pattern
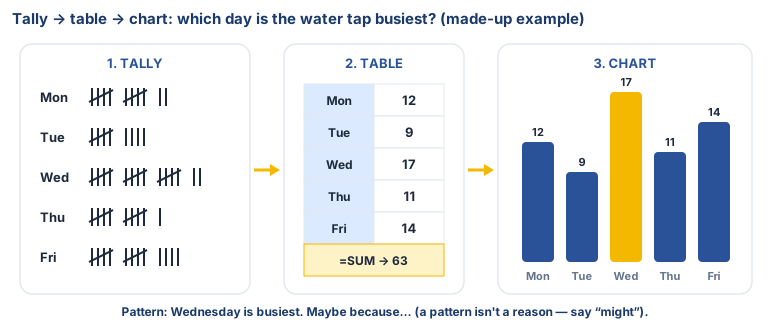
- Select your table, then Insert → Chart. Choose a Column (bar) chart. Choose a Line chart if your data changes over time (like temperature across a day).
- Give the chart a title and label the axes.
- Look at your chart carefully and answer in one sentence each:
- The pattern: "We noticed that…"
- Was our prediction right? "We guessed… and the data shows…"
- A possible reason: "This might be because…"
- What we are not sure about: "We would need more data to know if…"
Period 5: Present one slide
- Open LibreOffice Impress and make one slide with:
- your question (title)
- your chart (copy from Calc, paste into Impress)
- the pattern, in one sentence
- one idea to help the school based on what you found
- Each group presents for 2 minutes. Every member says at least one sentence.
- The class asks each group one question.
No laptop today?
Draw the table and a bar chart on chart paper using a ruler, and present the poster instead of a slide. The rubric is the same.
Rubric (for teacher and self-assessment)
Each group is described against the skill, not compared with other groups. There is no ranking, no "best group" and no leaderboard. Every group that meets the skill has succeeded.
Asking a question
- Getting there:The question is vague or cannot be counted
- Got it:The question is clear and can be answered by counting or measuring
- Going further:The question is clear, safe, and useful to the school
Collecting data safely
- Getting there:Some personal data was collected, or the data is incomplete
- Got it:Data is complete, and no personal data was collected
- Going further:Notes explain unusual days, and the method is fair
Organising in Calc
- Getting there:Data is typed with errors
- Got it:The table is correct and checked, with a total calculated
- Going further:Uses MAX or AVERAGE correctly
Chart
- Getting there:The chart is missing a title or labels
- Got it:The chart has the correct type, a title, and labels
- Going further:The chart type is chosen for a reason the group can explain
Finding the pattern
- Getting there:Describes the numbers only
- Got it:States a pattern and checks the prediction
- Going further:Gives a possible reason, and says what is still uncertain
Presenting
- Getting there:Some members did not speak
- Got it:Everyone spoke, and the slide is clear
- Going further:Gives a practical idea to help the school
Laptop and typing skills
- Getting there:Needed help with most steps
- Got it:Did most steps alone
- Going further:Helped another group without doing it for them
My reflection sheet (each student fills in alone, and it is private to them and the teacher)
- The question our group asked was: ______________________
- My job in the group was: ______________________
- One thing I can now do on the laptop that I couldn't do in March: ______________________
- The pattern we found was: ______________________
- Something that surprised me: ______________________
- One way our data could be wrong or unfair: ______________________
- If an AI learned from our data, what might it get wrong? ______________________ 7b. In Lesson 2.5 you read how the hadith scholars checked the chain behind every report before they accepted it. What did you do to check your data was correct? ______________________
- I am proud that I: ______________________
- Next time, I would: ______________________