Class 7 · Unit 1: Three techniques · Lesson 1.2 · 40 min
Regression: predicting a number
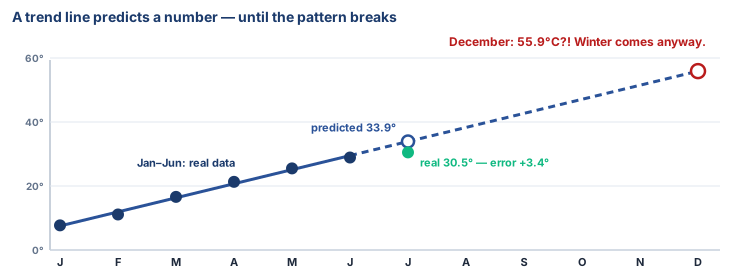
Every month from January to June got warmer. So July will be hotter still… and December? A trend line says 56 °C.
Today you will: Draw a trend line through real Srinagar data · Predict July and measure your error · Catch the moment a trend stops working
Story
It is the end of June. Hiba is planning a school picnic to Pahalgam for July.
Bilal: “How hot will it be?”
Hiba opens last year's weather notes. "January was cold, and every month after that got warmer, by about four or five degrees each time. So July will be… even hotter!"
Grandfather laughs. "Will it keep getting hotter forever, then? Until December?"
How do we predict a number from past data, and when does the trick stop working?
Watch
Regression, predicting a number — scan code 7.1.2 in the printed book.
Warm up your fingers
Skill: numbers and the decimal point (7 min)
- On typing.com, do a number row practice lesson.
- Then type these temperatures into a blank sheet, one per cell, pressing Enter after each:
7.7·11.1·16.6·21.3·25.5·28.9 - Use the full-stop key for the decimal point, not a comma.
On the laptop
You need: LibreOffice Calc — you type the data yourself (that's your typing practice too)
Mission 1: The data (alone or pairs, 5 min)
- ☐1
New Calc file, save as
july-prediction.ods. Headings: A1Month number, B1High (°C). - ☐2
Type months 1 to 6 in A2:A7 and Srinagar's average highs in B2:B7: 7.7 · 11.1 · 16.6 · 21.3 · 25.5 · 28.9 (Jan–Jun, 1991–2020 averages).
Mission 2: The trend line (5 min)
- ☐3
Select A1:B7. Insert → Chart… → XY (Scatter) → Points only → Finish.
- ☐4
Double-click the chart, right-click a point → Insert Trend Line… → Linear, tick Show equation. This line is your regression model.
Mission 3: Predict, then check (6 min)
- ☐5
Predict: July will be ___ °C. Write your guess before the formula.
- ☐6
In A9 type
7, in B9=FORECAST(A9;B2:B7;A2:A7). The real July high is 30.5 °C. In C9 type=B9-30.5— that's your error. - ☐7
Now predict December (month 12) the same way. Does the answer make sense? Why not?
No laptop today?
Plot the six points on squared paper (months across, temperature up). Lay a ruler through the middle and draw the line. Read off July and compare with the real 30.5 °C.
Now you know
- Regression predicts a number — temperature, price, marks — not a group.
- A trend line is the simplest model: it finds the trend in past data and follows it to new values.
- Error = prediction − real value. Every prediction has some; good models keep it small.
- A trend only works while the pattern holds. Always ask: is this still the same pattern?
Debate it
A company uses regression on past exam marks to predict each student's marks in the final exam, and the school uses the prediction to decide who may sit for science.
Is that fair? What could a student do that the past data could not predict?
Check yourself — practice, not a test
1. Regression is used to predict:
- ○ A group, like "spam"
- ○ A number, like tomorrow's temperature
- ○ Groups that have no labels
- ○ A password
2. A trend line that fits January to June perfectly will also predict December correctly.
- ○ True
- ○ False
3. The model predicted 34 °C and the real value was 30.5 °C. The error is:
- ○ 64.5 °C
- ○ 3.5 °C
- ○ 30.5 °C
- ○ 0 °C
4. Match each question to what it predicts:
How many kg of apples will this orchard give? · Is this apple A, B or C grade? · What will the fruit sell for next week in rupees?
Match with: A group (classification) · A number (regression)
Remember
Regression = using past numbers to predict the next number, and checking how far off we were.