Class 7 · Unit 2: Domains of AI · Lesson 2.1 · 40 min
Data science — from numbers to a decision
Snow for three days. "Half the class stayed home again!" Did they really? The answer is already sitting in the register.
Today you will: Clean a register with a mistake in it · Compare snow days with clear days · Turn a chart into a decision — and its limit
Story
It is the first week of January. Snow has been falling on Bilal's village for three days.
Bilal: “Half the class stayed home again. Sir is thinking of starting school at 11 o'clock instead of 10.”
Hiba, who likes to be sure, asks: "Is half the class really missing? Or does it just feel like that? Is it worse on snowy days, or on Mondays? We have the register. The answer is already in the numbers."
Can a list of numbers help a school make a better decision?
Watch
What is Data Science? — — scan code 7.2.1 in the printed book.
Warm up your fingers
Skill: number row, 1 to 5 (7 min)
- On typing.com, open the lesson on the top-row numbers 1–5.
- Keep your fingers on the home row and reach up for each number, then come back home.
- Today you will type attendance numbers, so the number row matters.
- Goal: your own best accuracy, 90% or more.
On the laptop
You need: LibreOffice Calc · attendance-winter.ods — 20 January days for a class of 40, made up for teaching: date · day · snow? · present
Mission 1: Clean (pairs, 3 min)
- ☐1
Look down column D. One row says
400and one cell is empty. - ☐2
A class of 40 can't have 400 present — it's a typing mistake. Change it to
40. - ☐3
For the empty cell, write
?in column E (Notes) and leave it out. Guessing would make the data dishonest.
Mission 2: Analyse (pairs, 5 min)
- ☐4
Predict: on snow days, will about 10 fewer children come, 20 fewer, or none fewer? Write it in G1.
- ☐5
G2
Average on snow days, H2=AVERAGEIF(C2:C21;"Yes";D2:D21). G3Average on clear days, H3=AVERAGEIF(C2:C21;"No";D2:D21). How close was your guess?
Mission 3: Visualise and decide (pairs, 8 min)
- ☐6
Select columns A and D, Insert → Chart → Column. Colour the snow-day bars differently (right-click a bar → Format Data Point).
- ☐7
In G5: "The data suggests the school should…" In G6: one thing the data can't tell us — like why children stayed home.
No laptop today?
Copy the 20 rows from the printed table into your notebook. Circle the snow days. Work out the average present on snow days and on clear days, draw a bar for each, and write your decision underneath.
Now you know
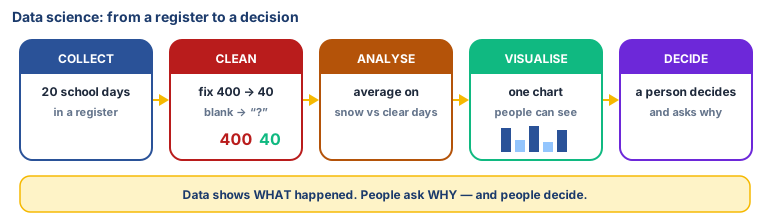
- Data science finds patterns in data to help people decide and predict.
- Five steps: collect → clean → analyse → visualise → decide.
- Cleaning matters. One wrong number — 400 for 40 — changes the answer.
- A chart lets people see a pattern fast.
- People still ask why and people make the decision.
Debate it
The data shows that attendance drops on snow days. One person says: "Just mark the absent children as late and move on." Another says: "Start school later on snow days." A third says: "Ask the families what the real problem is: roads, cold, or no warm clothes?"
Which idea uses data best? What other data would you want to collect?
Check yourself — practice, not a test
1. Which is not one of the three domains of AI?
- ○ Data Science
- ○ Computer Vision
- ○ Natural Language Processing
- ○ Spreadsheet Typing
2. Put the steps of a data science project in order:
- 1. **Collect
- 2. Visualise
- 3. Decide**
- 4. Clean
- 5. Analyse
3. If a number in a dataset looks wrong, it is fine to guess a new one so the sums work.
- ○ True
- ○ False
4. Data science finds ______ in data to help people make decisions.
Remember
Data Science turns numbers into decisions, but people make the decision.