Class 7 · Unit 4: Data visualisation · Lesson 4.3 · 40 min
Preparing data
The Chillai Kalan log is a mess: a day written twice, a day left blank, "lots" instead of a number, dates all jumbled. You can't chart that — yet.
Today you will: Clean a messy log in four steps · Mark missing data — never make it up · Find which month was wetter
Story
During Chillai Kalan, the forty coldest days of winter, Bilal's school kept a daily rainfall-and-snow log. Different students filled it in each day.
When Bilal opens it in March, it is a mess: - 3 January is written twice. - 10 January is empty. That was a snow holiday and nobody came to school. - One day says "lots" instead of a number. - The dates are jumbled.
Hiba: “We can't make a chart from this. First we have to prepare it.”
Watch
Four steps to prepare data — — scan code 7.4.3 in the printed book.
Warm up your fingers
8 minutes on typing.com: sentences with numbers.
- Term 2 lessons, then type these dates exactly:
2026-01-03,2026-01-10,2026-01-17,2026-01-24. - Use the number row, not the number pad, so both hands stay near home row.
On the laptop
You need: LibreOffice Calc · unit-4/rain-log-messy.ods
Mission 1: Errors and duplicates (pairs, 6 min)
- ☐1
Open
rain-log-messy.odsand save a copy at once asrain-log-clean.ods. Always keep the original. - ☐2
Predict: which month was wetter — December or January? Note it.
- ☐3
Find
lotsin Rain/Snow (mm). You can't know the real number — delete the word, leave the cell empty. - ☐4
Select the data, Data → More Filters → Standard Filter:
Date = Not Empty, tick Options → No duplications, Copy results toF1. Use the new copy.
Mission 2: Missing values and order (pairs, 5 min)
- ☐5
Type
missingin Note beside each empty cell. For 10 January only, your teacher gives the weather-station value — type it and notefrom station. - ☐6
Data → Sort by Date, ascending.
Mission 3: Group and answer (pairs, 5 min)
- ☐7
Add a Month column (
DecorJan). Under the data:December totalandJanuary totalwithSUM. - ☐8
One sentence: which month was wetter, and does a missing value make you less sure? Save.
No laptop today?
Your teacher writes the 12-row messy log on the board. In pairs, rewrite it cleanly: cross out the duplicate, mark the missing values, put the dates in order, and total each month.
Now you know
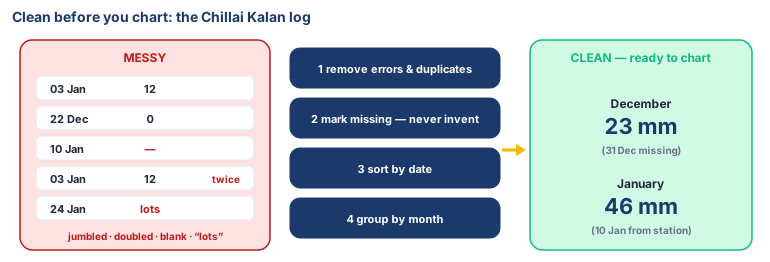
- Prepare before you chart. Messy data makes misleading charts.
- Step 1 — errors and duplicates: nothing counted twice or read wrong.
- Step 2 — missing values: mark them, or fill from a trusted source and say so. Never invent a number.
- Step 3 — order: by date, size or name.
- Step 4 — group: by week, month or type, so patterns appear.
Debate it
For 10 January, one student suggests: "Just type 0. Nobody came to school, so nothing fell." Is that honest? What might a weather AI learn from it?
Check yourself — practice, not a test
1. Put CBSE's steps for preparing data in order:
- 1. Arrange data in order
- 2. Fill missing values
- 3. Group related items
- 4. Remove errors or duplicates
2. A value is missing and you don't know it. The most honest thing is to:
- ○ Type 0
- ○ Type the biggest number in the column
- ○ Mark it as missing, or fill it from a trusted source and note that
- ○ Delete the whole dataset
3. If the same day appears twice, its rain will be counted twice in the total.
- ○ True
- ○ False
4. Before you start cleaning, always save a ______ of the original file.
Remember
Clean, fill honestly, sort, group. Then chart.