Class 8 · Unit 4: Data and fairness · Lesson 4.2 · 40 min
Finding bias in a dataset
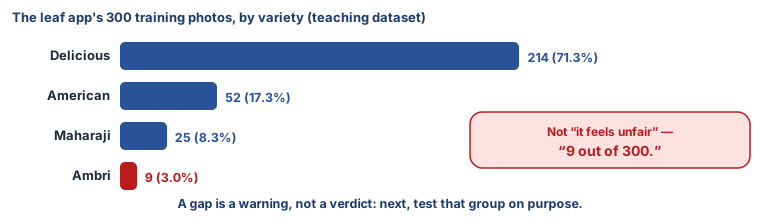
“I knew it was unfair,” says Bilal. “Knowing isn't showing,” says Hiba. One formula later: Delicious 214, Ambri 9.
Today you will: Count who's in a dataset · Compare the data's share with the world's · Find the gap in languages too
Story
In Class 7, Bilal's uncle's leaf app failed on his Ambri trees. This year the class has the app company's own training list: 300 rows, each naming the variety, the district and the light the photo was taken in.
Bilal: “I knew it was unfair.”
Hiba: “Knowing isn't showing.” (She sorts the sheet, types one formula, and reads the answer aloud.)
Delicious: 214 photos. Ambri: 9.
Bilal stares. "Nine."
Hiba: “Now you can tell them. Not 'it feels unfair'. Nine out of three hundred.”
Watch
Counting, not arguing — — scan code 8.4.2 in the printed book.
Warm up your fingers
Skill: numbers and formula symbols at speed (Term 2 focus, 6 min)
- On typing.com, do one number-row or symbol lesson.
- Then type this line three times in Calc's input bar without looking down:
=COUNTIF(B2:B301;"Ambri")/300*100
On the laptop
You need: LibreOffice Calc · dataset-audit.ods (300 rows: photo id · variety · district · light · camera) · language-data.ods (illustrative)
Part A: Count the groups (8 min, in pairs)
Mission 1: Your mission
- ☐1
Save a copy with your names. List the varieties: Delicious, Ambri, American, Maharaji.
- ☐2
Predict: what share will Ambri have? Then count each:
=COUNTIF($B$2:$B$301;E2)and a percentage:=F2/300*100. - ☐3
Do the same for district and light.
Part B: Chart the gap (8 min)
- ☐4
Bar chart of the variety shares, titled "Share of the training data".
- ☐5
Add the real share of Kashmir's orchards your teacher gives you, and chart the two together. Finish: "The biggest gap is ___: ___% of the data and about ___% of the orchards."
Part C: The same test, on languages (4 min)
- ☐6
Sort
language-data.odsby hours of data. Where is Kashmiri? "A tool trained on this would work best for ___ and worst for ___."
No laptop today?
Tally a printed 60-row extract by hand, work out the percentages, draw the bar chart on squared paper, and write the gap sentence.
Now you know
- Representation is a group's share of a dataset: its count ÷ the total.
- Find a gap by comparing the share in the data with the share in the world where the tool will be used.
- A count beats an impression. "It feels unfair" can be dismissed; "9 out of 300" can't.
- A gap is a warning, not a verdict next, test that group on purpose.
- A low-resource language , like Kashmiri, has little recorded data, so tools work worse — a fact about the data, never the speakers.
Debate it
The company could answer: "We used the photos we could get. Nobody sent us Ambri leaves."
Is that a fair answer? Whose job is it to go and collect the missing data — and who should pay for it?
Check yourself — practice, not a test
1. What does representation mean when auditing a dataset?
- ○ How pretty the chart looks
- ○ What share of the dataset each group makes up
- ○ How accurate the model is overall
- ○ How many people use the app
2. A language with very little recorded or written data available for training is called a ______ language.
3. Finding that a group has only 3% of the rows proves the model will harm that group.
- ○ True
- ○ False
4. Put an audit in the right order:
- 1. Test the model on the under-represented group
- 2. Turn the counts into percentages
- 3. Compare with the real-world share
- 4. Count the rows in each group
- 5. Decide which groups to count
5. Which comparisons help show a gap? (choose all that apply)
- ○ Share of photos of each variety vs. share of orchards planted with it
- ○ Hours of speech data per language vs. number of speakers
- ○ The file size of the dataset vs. the laptop's memory
- ○ Photos taken in sunshine vs. photos taken in shade, where both are common
Remember
Measure first. "Nine out of three hundred" is an argument. "It feels unfair" is not.