Class 9 · Unit 2: Data literacy · Lesson 2.1 · 40 min
What data literacy is
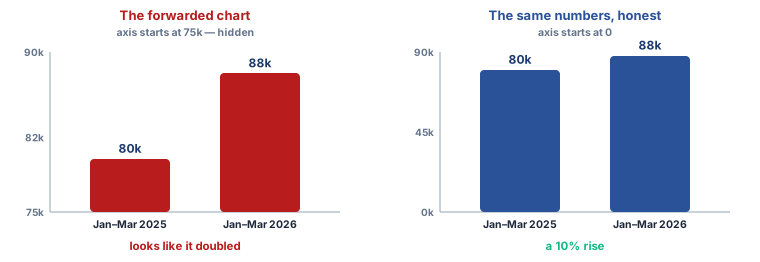
“TOURISM DOUBLES IN KASHMIR!” Two bars, no numbers. Bilal's uncle wants to buy a second shikara.
Today you will: Question any chart: numbers, source, period · Climb the data pyramid · Tell quantitative from qualitative data
Story
A message reaches Bilal's family group. A bar chart, no source, one line of text:
"TOURISM DOUBLES IN KASHMIR — BEST YEAR EVER!"
Two bars. The right-hand one is twice the height of the left. Underneath, in small grey letters, the words Jan–Mar.
Bilal's uncle is delighted. He is thinking of buying a second shikara.
Hiba looks at the chart for a long time. The bars have no numbers on them. The axis starts somewhere, but you cannot see where. Nothing says which years these are, who counted, or what counts as a tourist.
Hiba: “It might be true. But this picture cannot tell us whether it is.” (at last.)
Her uncle asks the only question that matters: then what would?
Watch
Reading data like a scientist — — scan code 9.2.1 in the printed book.
Warm up your fingers
Skill: the symbols Calc runs on (Term 1 focus, 5 min)
-
On typing.com, open the symbols lessons.
-
Then type this line ten times, without looking down. It is a real Calc formula, and every symbol in it is one you will need today:
=AVERAGE(B2:B13) -
The two you will mistype are
(and:— the left bracket takes the right little finger with Shift, and the colon takes Shift too.
On the laptop
You need: LibreOffice Calc · charts-three.ods · chart-read.ods
Mission 1: Three charts, five questions (12 min, in pairs)
- ☐1
Open
charts-three.ods— look at Sheet 1 only. Savechart-read.odswith your roll numbers. - ☐2
For each chart, answer five questions in one row: What does it show? · Where did the numbers come from? · What period? · What can it not tell you? · What decision would you trust it for?
- ☐3
Beside each row, write
quantitativeorqualitativefor its data. (Sheet 3 has both.)
Mission 2: Judge them (6 min)
- ☐4
Predict: which chart will turn out least trustworthy? Then rank all three, most to least, in one sentence. The prettiest chart is not the answer.
- ☐5
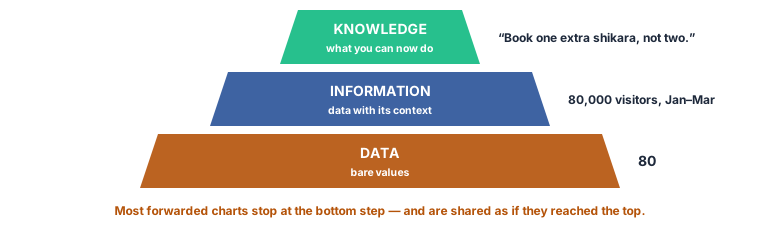
For the one you trust most, climb the pyramid in three lines: data · information · knowledge.
- ☐6
For the one you trust least, write the one extra fact that would change your mind.
Finished early?
Redraw the least trustworthy chart so it could no longer mislead.
No laptop today?
Your teacher draws the three charts on the board. Pairs answer the five questions in their notebooks, then the class agrees a ranking — and argues about it.
Now you know
- Data literacy is being able to read data, work with it, analyse it, and argue with it. CBSE's Data Literacy Process Framework runs these as a loop.
- A chart is an argument, not a fact. Ask for the numbers, the source and the period before you believe it.
- Quantitative data is numbers (minutes, rupees). Qualitative data is categories (variety, village, yes or no).
- Data supports decisions; it doesn't make them. A person decides, and can be asked why.
- If the source is missing, that is the finding.
Debate it
Bilal's uncle says: "Everyone is sharing it, so there must be something in it."
Does a claim become truer because more people forwarded it? What would you say to him — in a way he'd actually listen to?
Check yourself — practice, not a test
1. Data literacy means being able to: (choose all that apply)
- ○ Read data
- ○ Work with data
- ○ Analyse data
- ○ Argue with data, including against a weak claim
- ○ Memorise every number in a table
2. A chart shows two bars with no numbers, no source and no dates. The best response is to:
- ○ Accept it, because a chart is evidence
- ○ Reject it, because all charts lie
- ○ Ask for the numbers, the source and the period before deciding anything
- ○ Forward it and let others decide
3. A chart of how many children were absent can tell you why they were absent.
- ○ True
- ○ False
4. Data supports an informed decision, but the ______ still makes it and must be able to explain it.
5. Match each chart problem to the question it stops you answering:
No numbers on the bars · No source · No period
Match with: Over what time did this happen? · How big is the change? · Who counted, and can I check?6. Put the three steps of the data pyramid in order, from the bottom up:
- 1. Knowledge — something you can act on
- 2. Information — data with context
- 3. Data — bare values
7. Quantitative or qualitative?
Minutes taken to reach school · Apple variety · Rupees per box · Village name
Match with: Qualitative · Quantitative
Remember
Reading a chart is easy. Naming what it cannot say is the skill.