Class 9 · Unit 2: Data literacy · Lesson 2.4 · 40 min
Interpreting data, and its limits
Feed a model the grower's name and it gets good at predicting. So what has it learned about the apple? Nothing.
Today you will: Choose three features and defend them · Spot a proxy that describes a person · Interpret data in words someone can act on
Story
The group's plan is to predict an apple's grade — A, B or C — from the data the packing shed already records.
The shed's file has twelve columns. Bilal wants to use all twelve.
Bilal: “More information, better prediction.”
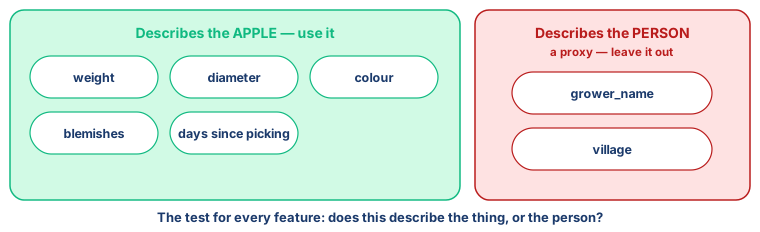
Hiba is reading the column names. Weight. Diameter. Colour. Blemishes. Variety. Days since picking. Altitude of the orchard. Grower's name. Village.
She stops at the last two.
Hiba: “If we feed it the grower's name, and the machine gets good at predicting… what has it actually learned about the apple?” (slowly)
Nothing. So what has it learned about instead?
Watch
Choosing what the machine sees, and saying what it means — — scan code 9.2.4 in the printed book.
Warm up your fingers
Skill: typing column names exactly (Term 1 focus, 5 min)
-
On typing.com, continue the symbols and capitals lessons.
-
Then type this list twice, exactly, with the underscores and no spaces:
weight_g diameter_mm colour_score blemish_count days_since_picking -
Column names have to match exactly or a formula fails. This is why programmers avoid spaces and capitals in them — a habit worth starting now, before Unit 5.
On the laptop
You need: LibreOffice Calc · apple-features.ods (30 apples, 12 columns) · feature-choice.ods
Mission 1: Choose three (8 min, in pairs)
- ☐1
Open
apple-features.odsand read only the column names. - ☐2
Choose exactly three features to predict grade. In
feature-choice.ods, fill: Feature · Why it should help · What it leaves out · Describes the apple, or the person?
Mission 2: Check against the data (5 min)
- ☐3
Predict: which of your three will move most with grade? Then test each with
=CORREL(feature column; grade column). Add a column: did the data agree?
Mission 3: The fourth row (3 min)
- ☐4
Add
grower_nameand fill all four columns honestly. Then two sentences: what would a model trained on it actually learn — and who would be harmed?
Mission 4: Interpret (2 min)
- ☐5
Three lines, each labelled
quantitativeorqualitative: what the numbers say · what the categories say · what you'd tell the packing shed to do, with one limit.
Finished early?
Swap with another pair. Write the best thing about their choice and one thing it can't see.
No laptop today?
The twelve column names go on the board. Pairs choose three, defend them in their notebooks, and
do the grower_name row. The class votes on the best three.
Now you know
- Features are what the model may see; the label is what it predicts. Grade is the label; weight is a feature.
- Choosing features decides what the model can notice and every feature leaves something out.
- More is not better. Useless columns add noise; harmful ones add bias with a respectable name.
- A proxy describes a person, a place or a history instead of the thing — grower's name, village, surname.
- Interpretation turns numbers into a sentence someone can act on — quantitative (what the numbers say) and qualitative (what the categories say) — and it carries its limit.
Debate it
The shed's manager argues: "Some growers really are more careful. Their fruit really is better. The column is accurate."
He may be right. Is an accurate feature always a fair one? What happens to a careful new grower whose name the model has never seen?
Check yourself — practice, not a test
1. In "predict an apple's grade from its weight and colour", the label is:
- ○ Weight
- ○ Colour
- ○ Grade
- ○ The orchard
2. A proxy feature is one that:
- ○ Is measured twice
- ○ Stands in for something else, often a person or place, rather than the thing itself
- ○ Has missing values
- ○ Is always the most accurate
3. Adding more features always makes a prediction better.
- ○ True
- ○ False
4. Which of these describe the apple rather than the person? (choose all that apply)
- ○ Weight in grams
- ○ Grower's name
- ○ Blemish count
- ○ Village
- ○ Days since picking
5. Every feature leaves something out; a good data worker says what, at the moment they ______ it.
6. Analysis gives you the figure "average weight of grade A = 190 g". Interpretation is:
- ○ Repeating the figure more loudly
- ○ Saying what it means for the shed, and stating the limits of the claim
- ○ Drawing a second chart of the same numbers
- ○ Collecting the data again
7. Which kind of interpretation?
"Grade A apples averaged 40 g heavier than grade C" · "Ambri appears far more often in the grade A rows than American"
Match with: Qualitative · Quantitative
Remember
Ask of every feature: does this describe the thing, or the person? Then say what the numbers mean — and what they cannot.