Class 9 · Unit 3: Maths for AI · Lesson 3.5 · 40 min
When the numbers mislead
Three notices. “Average journey: 20 minutes.” “Our app is 80% accurate.” “90% say snow doesn't stop them.” None is a lie.
Today you will: Split an average that hides two groups · Distrust a percentage without a count · Ask who a survey couldn't reach
Story
Three notices go up in the school corridor on the same morning.
—: “Average journey to school: 20 minutes.” (So the first period will now begin twenty minutes after the gate opens.)
—: “Our leaf app is 80% accurate.” (Tested last Tuesday.)
—: “90% of students say snow does not stop them reaching school.” (Surveyed in January.)
Hiba reads all three and believes none of them.
Not one of those numbers is a lie. So what is wrong with them?
Watch
Three true numbers that mislead — — scan code 9.3.5 in the printed book.
Warm up your fingers
4 minutes on typing.com: accuracy under thought.
- Term 2 accuracy lessons. Target 94%, speed second.
- Then type these five times each, without looking down. You will need every one today:
=COUNTIF(=AVERAGE(=MEDIAN(">20"=RANDBETWEEN(
On the laptop
You need: LibreOffice Calc · misleading.ods (sheets Walk, Sample, Survey)
Part A: The average that describes nobody (6 min, in pairs)
Mission 1: Your mission
- ☐1
Sheet Walk: fifteen journey times. In E2
=AVERAGE(B2:B16), in E3=MEDIAN(B2:B16), and in E4 count who takes longer than 20:=COUNTIF(B2:B16;">20"). - ☐2
Look at column B, not the formulas. How many kinds of journey are there?
- ☐3
Split them: walkers
=AVERAGE(B2:B12), bus=AVERAGE(B13:B16). Finish: "One average said 20. Two say ___ and ___." Part B: The accuracy that changed without the app changing (7 min)
- ☐4
Sheet Sample: forty photos,
1right,0wrong. Score the first 5, 10, 20 and 40 withAVERAGE, as percentages. - ☐5
Predict: will a random five photos give a higher or lower score than all forty? In E7
=RANDBETWEEN(2;37), average that row and the four below, and press Ctrl+Shift+F9 five times. Part C: The survey that couldn't hear its own answer (5 min)
- ☐6
Sheet Survey: Survey A (snow day, 30 students) and Survey B (a week later, 45). Work out the "No problem" percentage for each.
- ☐7
Who was in B who couldn't have been in A? Write the sentence A should have printed under its 90%.
Finished early?
On Sample, find the best five in a row and the worst five. Title them "the same app, twice".
No laptop today?
Read the fifteen times aloud; half the class finds the mean, half the median. Write the forty 1s and 0s on the board; groups score any five in a row and call out their percentage — the spread across the room is the lesson. Then read both surveys and ask who was missing.
Now you know
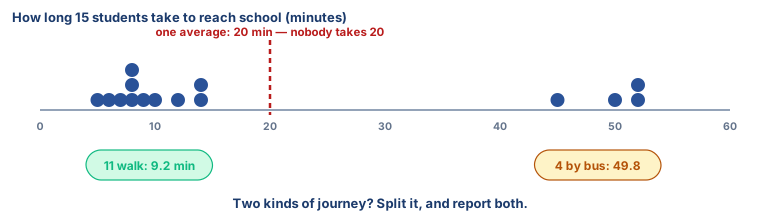
- One average over two groups describes neither. When a list holds two kinds of thing, split it and report both.
- A percentage without a count is half a claim. 4 of 5 and 80 of 100 are both 80% — only one would survive tomorrow.
- A sample can't answer for people it couldn't reach. Survey A was taken among those who'd already got through the snow.
- This is AI bias, one step earlier: a model works for whoever happened to be in its data.
- Three questions before you believe a number: how many? who? compared with what?
Debate it
An orchard app advertises 90% accuracy. In the small print: tested on ten photographs, taken in one orchard, on one sunny morning in September, by the person who built it.
Write the three questions you would ask before your family spent money on it — and say which of the three notices in the story each question would also have caught.
Check yourself — practice, not a test
1. Eleven students take 5–14 minutes to reach school; four take 45–52. Which single number best describes a typical student?
- ○ The mean of all fifteen
- ○ The median of all fifteen
- ○ The range
- ○ The largest value
2. An app that scored 80% on five photos is more reliable than one that scored 62% on forty.
- ○ True
- ○ False
3. A survey taken only from students who reached school through the snow is a ______ sample.
4. Which questions should you ask before believing a percentage? (choose all that apply)
- ○ How many were counted?
- ○ Who was asked, and who could not answer?
- ○ What is the spread behind the average?
- ○ Which colours the chart used
5. Match each claim to the fault in it.
"Average journey: 20 minutes" · "80% accurate, tested Tuesday" · "90% say snow is no problem"
Match with: two groups under one average · the people it was about were missing · sample too small
Remember
Before you believe a number, ask three things: how many, who, and compared with what?